
The short answer
Marketing budgets average 7.8% of company revenue in 2026 (Gartner). 84% of U.S. adults use YouTube (Pew). 91% of businesses use video in their marketing (Wyzowl).
- 15.3% of marketing budgets now go to AI
- 56% of CMOs say their budget falls short
- 71% of U.S. adults use Facebook, 37% use TikTok
- 85% of video marketers say video helps generate leads
Originally published November 2019. Updated November 5, 2026.
Updating your strategy for your marketing shouldn’t be done in the dark…
If you do it, without looking at these important statistics, you could just waste 10’s or even 100’s of thousands of dollars. Here’s the thing:
- People have moved to mobile, and short-form video (and frequency) are incredibly important.
- Your polished brand video might not be as important as finding a way to entertain, and be part of cultural trends and be where they are (i.e. TikTok, Reels and Youtube Clips)
- Influencer marketing, subject matter expertise and niching will help you dominate in smaller and smaller groups, while retaining relevancy to the world at large to increase your algorithmic presence…
Sound like too much?
You got this… let’s break it down for you.

Marketing statistics for 2026
Fresh numbers first. Every stat below links to the original source.
Marketing budget statistics
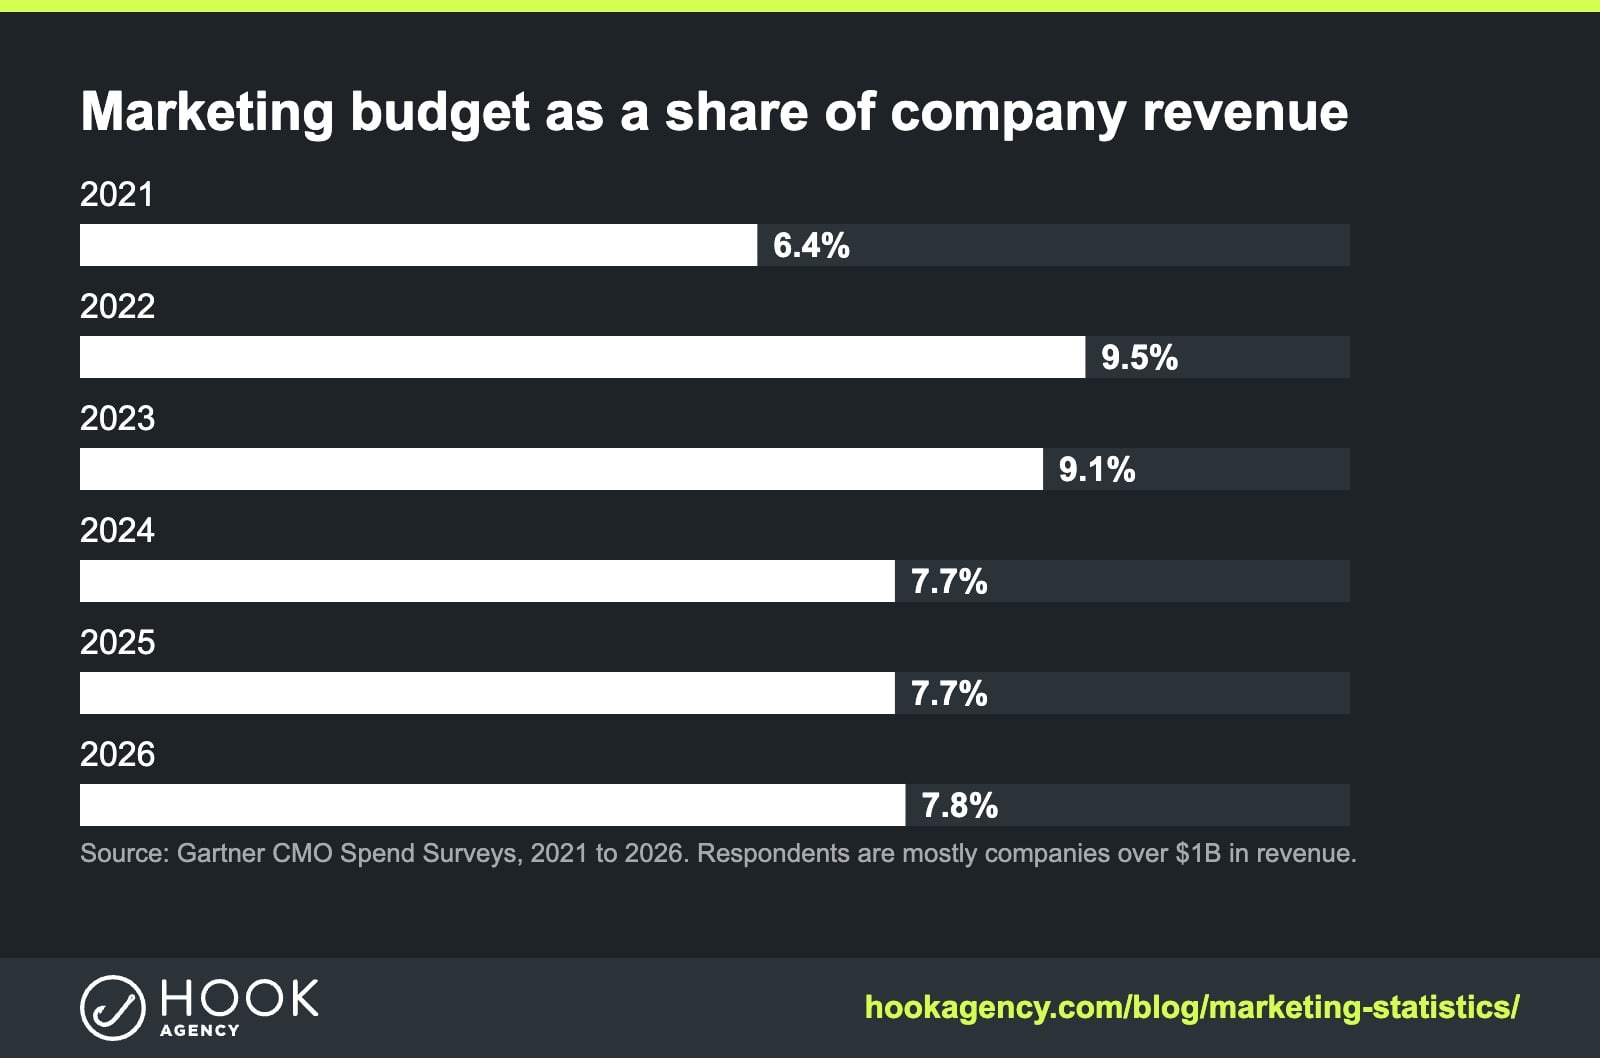
- Marketing budgets average 7.8% of company revenue in 2026, up from 7.7% in 2025. Source: Gartner
- CMOs now put 15.3% of their marketing budgets toward AI. Source: Gartner
- 56% of CMOs say they lack the budget to deliver their 2026 strategy. Source: Gartner
- Paid media made up 30.6% of the average marketing budget in 2025. Source: Gartner
Want to know what that means for a contractor? Read our guide on how much to spend on marketing. Short version: 5% to 7% of revenue for most home service companies.
Social media statistics
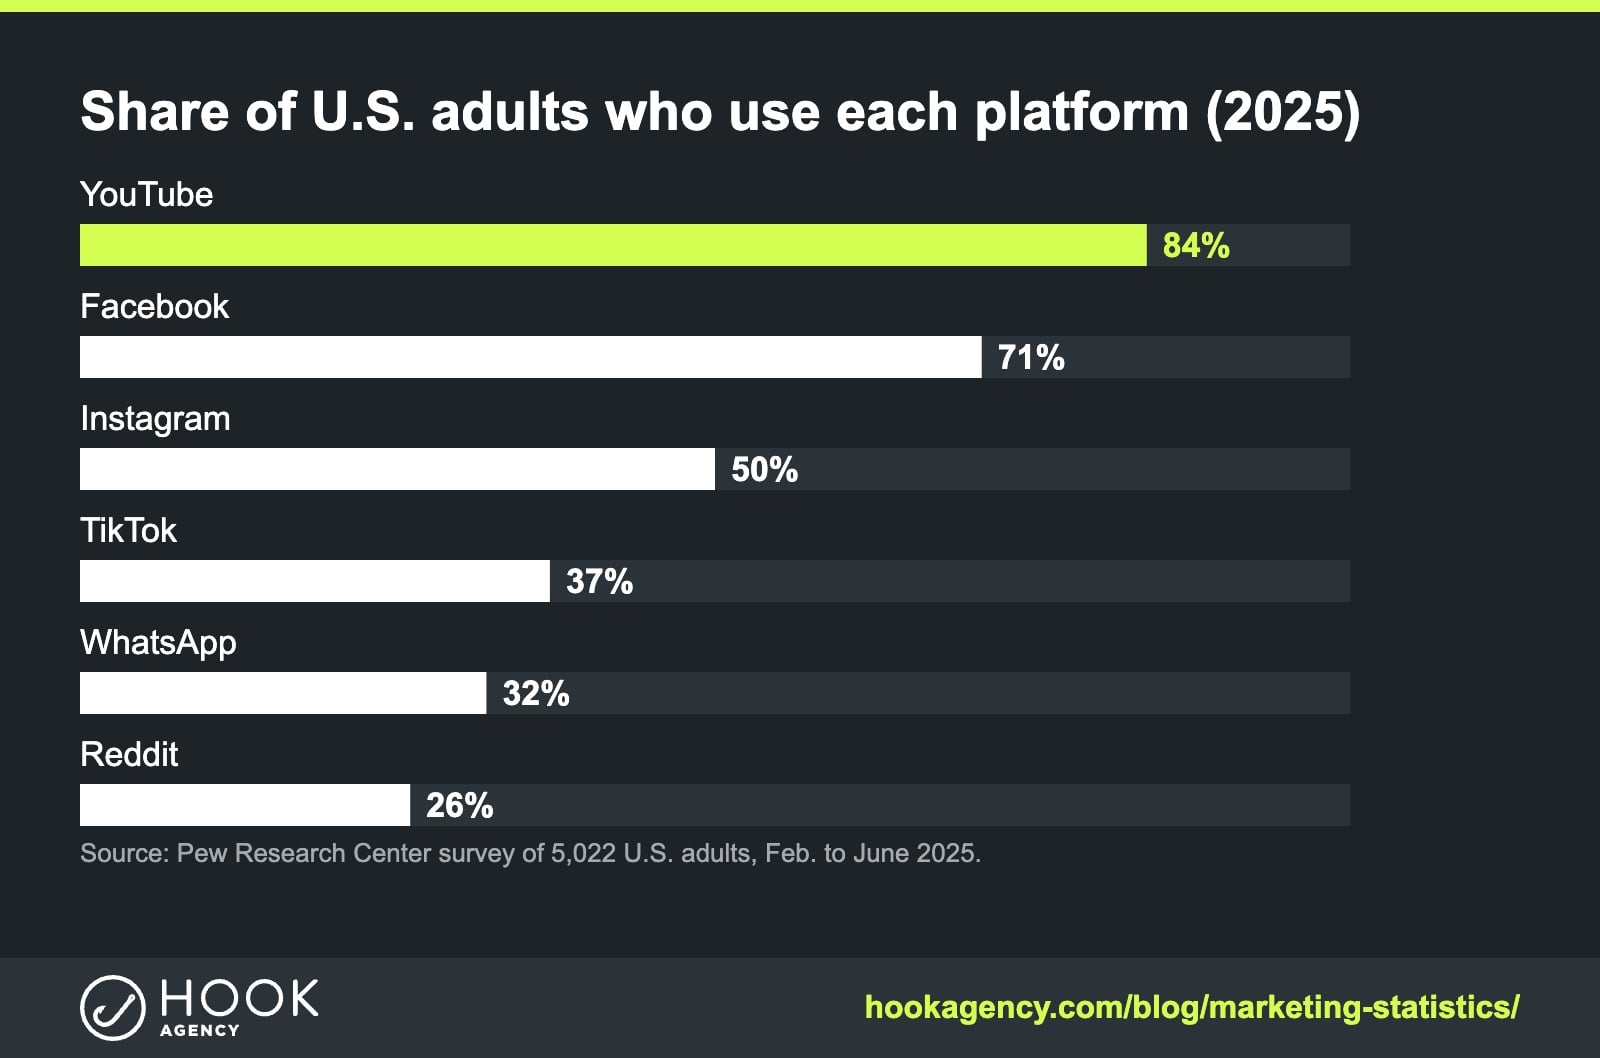
- 84% of U.S. adults use YouTube. Source: Pew Research Center
- 71% of U.S. adults use Facebook. Source: Pew Research Center
- 50% of U.S. adults use Instagram and 37% use TikTok. Source: Pew Research Center
Video marketing statistics
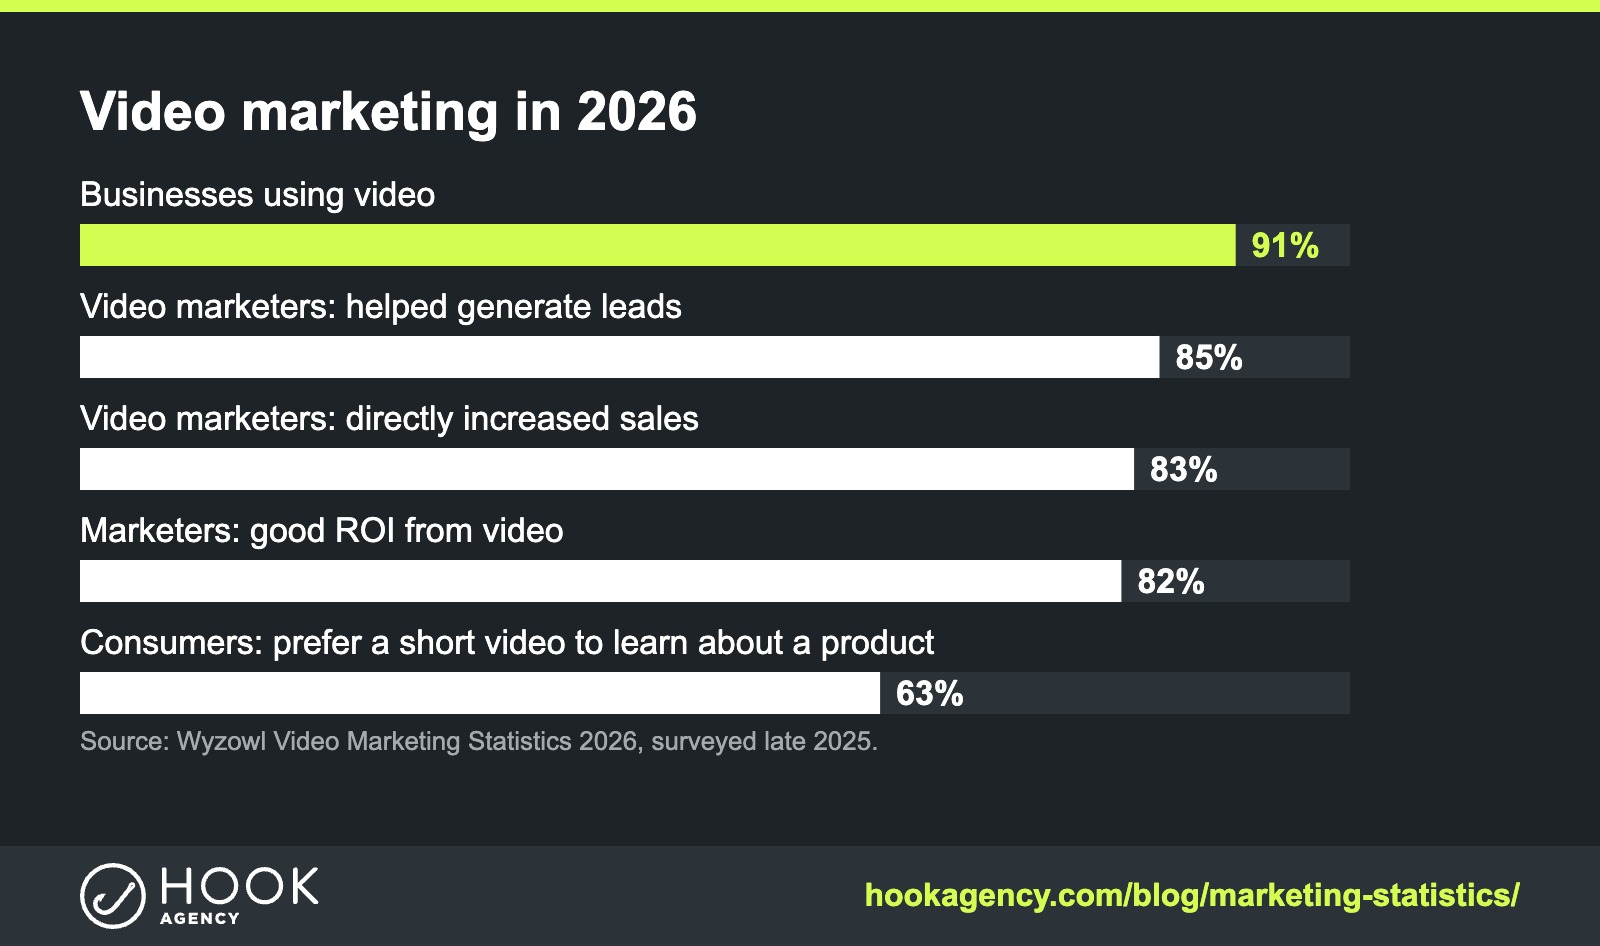
- 91% of businesses use video as a marketing tool. Source: Wyzowl
- 85% of video marketers say video has helped them generate leads. Source: Wyzowl
- 83% of video marketers say video has directly increased sales. Source: Wyzowl
- 63% of consumers would most like to learn about a product or service by watching a short video. Source: Wyzowl
Marketing statistics for contractors and home service businesses
Most marketing stats are built for big brands. Here is what matters if you run a roofing, HVAC, plumbing or other home service company, where the customer is local and usually ready to buy.
- 84% of consumers searched for a local business in the past three months. Source: BrightLocal, 2026
- 73% of local searches start on a phone. Source: BrightLocal, 2026
- 75% of consumers choose a local business in under 30 minutes, and 72% consider three or fewer options. Source: BrightLocal, 2026
- 97% of consumers read reviews for local businesses, and 31% will only use a business rated 4.5 stars or higher. Source: BrightLocal Local Consumer Review Survey, 2026
- 74% only consider reviews from the last three months. Source: BrightLocal, 2026
- 45% of consumers now use ChatGPT or other AI tools for local recommendations, up from 6% a year earlier. Source: BrightLocal, 2026
- 85% of small businesses have a Google Business Profile, but only 35% actively maintain it. Source: BrightLocal, 2026
More in our local SEO statistics and home services Google usage statistics.
- Leads from Google, Maps and AI search
- Nobody else is buying the same lead
- You own your website and ad accounts
“Hook Agency has been an incredible partner for our digital marketing growth.”
Kristin Sullivan, Bob’s ACFocused on the map? See Google Maps SEO
Historical marketing statistics (2022 to 2024)
These are from earlier versions of this post. We kept them for context. Some sources have since updated their numbers.
5 New Mind-Blowing Marketing Stats for 2024
- 45% of organizations don’t have a clearly defined digital marketing strategy. – According to SmartInsights
- In 2022, the average time spent on mobile devices increased 2.5% year-over-year (YoY) to over 4.5 hours per day. – According to InsiderIntelligence
- Posts with videos get 157% more search traffic than those that don’t – According to FirstPageStrategy
- 85% of marketers say short-form videos are the most effective format on social media – According to Hubspot
- One-quarter of Americans between 12 and 34 have used TikTok compared to 3% of adults aged 35+. – According to Hubspot
Since short-form video and TikTok are so huge in 2024 – what works on TikTok?
- Videos Based on Trending Sounds. One of the best types of video content to create for TikTok is videos based on trending sounds.
- TikTok Challenges.
- Videos Based on Trending Hashtags.
- Influencer Collaboration Videos.
- Lip-Syncing Videos.
- Tutorials.

5 Marketing Statistics for 2022
- Influencer Marketing is Growing (34% Said it was at the top of the list for marketing investments) – “When we asked global marketing professionals which trends they planned to invest in for 2022, above other trends like mobile web design and short-form video marketing.” – Hubspot
- Short-form Video is Huge (More than 31% of global marketers currently invest in short-form video content, 46% say it’s effective, 89% will continue it or increase their use of short-form video. )
- 28% of marketers saying they’re pushing on SEO into 2022. 84% of marketers are going to keep their effort the same or increase the level of effort on SEO.
- It was 1996 when Bill Gates said Content is King. Experts project that the content marketing industry itself will reach over $107.5 billion in 2026.
- 94% of respondents shared that watching a video has helped them make a purchase decision at least once. Of those, 72% were swayed by a product demonstration video.
A quick example of how marketing is changing in the past few years: In 2020 companies spent more than $79.27 billion on SEO and that’s more than triple what it was in 2010! (22.1B) So no – SEO is not dying, it’s tripling every 10 years.

Several of these stats are original to Hook Agency and resulted from polling 100 marketers and business owners as they ramped up for their 2022 marketing planning.

5 Quick Stats About Websites

- 70% of Marketers are unsatisfied with their website’s conversion rate. Source: Hook Agency
- Calls convert to revenue 10-15x more often than web leads. Inbound callers have a high purchasing intent and are usually further along in the customer journey than someone who fills out a web form. Source: BIA/Kelsey + Callers convert 30% faster than web leads. People often call because they need immediate assistance, they don’t have time to fill out a web form and wait around for a response (Source: Forrester).
- 62% of companies polled said they believe a website should be redesigned every 2-3 years. Source: Hook Agency
- 57% of internet users say they won’t recommend a business with a poorly designed website on mobile. Source: SocPub
- 75% of consumers admit to making judgments on a company’s credibility based on the company’s website design – Source: Kinesis
Looking to invest in your construction company’s website? Get inspiration by checking out our color schemes post, our website color schemes post, footer inspiration, roofing websites, construction websites, and electrical, solar, and plumbing websites.
5 Quick Stats About Marketing Budgets

- 48% of companies are spending between 4-10% of their revenue on marketing – Source: Hook Agency
- 50%+ of companies say the highest return on investment activities are search-related – including paid search, SEO, and content marketing. Source: Hook Agency
- 44.4% of companies said that their top marketing objective was to increase lead generation. Source: Hook Agency

- 69.7% of people said they were spending less than half of their marketing budgets on digital/online marketing for 2020. Source: Hook Agency

- The average percentage of revenue – that companies spend on marketing is 11.2%. Source: Brafton/Gartner CMO


5 Quick Stats about Content Marketing

- 69% of marketers believe the ideal content length for their website is 200-700 words, despite data-driven analysis that the ideal length to rank #1 on Google is 2,450 words. Source: Hook Agency
- The average blog post is now 1142 words. It’s 41% more than the average length three years ago. Today, to keep your audience engaged, you need to deliver remarkable content. Six times as many bloggers now write 2000+ word articles. Bloggers that write long articles are much more likely to report getting ‘strong results’. – Source: Elite Copywriter
- CMI found that 62% of “most successful” B2B marketers have a content marketing strategy in place and 59% of “most successful” B2C marketers have a strategy in place.
- In spite of the strong connection between documenting a strategy and tasting success, merely 37% of B2B brands and 38% of B2C brands have a documented strategy. Source: Content Marketing Institute
- 84% of people expect brands to produce content that entertains, provides solutions, and produces experiences and events. – Source: Meaningful Brands
5 Quick Stats about Paid Ads
- The average cost per action (CPA) is $49 for paid search and $75 for display ads. Source: WordStream
- In a recent study, omnichannel campaigns saw an 18.96% engagement rate, while single-channel saw just a 5.4% engagement rate. Source: ClickZ
- Including a video on your landing page can boost your conversion rate by up to 80%. (Unbounce) and on average, people spend 2.6x more time on pages with video than without. Source: Wistia
- Consumers are 27 times more likely to click on online video ads than standard banners. Source: CMO.com
- 36% of searches on Google are associated with a location. Source: CMO.com
Looking for a savvy marketing team? Some of the niches we serve: Roofing Marketing & Lead Gen, HVAC Marketing & Lead Gen, Construction Marketing & Lead Gen, Plumbing Marketing & Lead Gen. We also drive leads for all kinds of Home Services, including Solar, Windows & Doors, Electricians, and Remodelers.
5 Quick Stats about Video Marketing
- “Personalized video is an under-utilized tool and worth testing. From our experience, campaigns frequently generate 50%+ email open rates and 40%+ CTRs. The results speak for themselves.” Jon Mowat – Author and MD of Hurricane.
- The average user will spend 88% more time on a website with video content goes to show that long-form videos can help keep people interested in your message and your brand. Source: Oberlo
- 72% of people prefer to learn about a company via video rather than text. Source: Wyzowl
- Videos on LinkedIn are 5X more likely to get comments. Source: HootSuite
- Mobile video consumption rises by 100% every year. (Insivia) and by 2022, online videos will make up more than 82% of all consumer internet traffic, 15 times higher than it was in 2017. Source: Cisco
5 Quick Stats about Social Media
- 68% of United States adults are active Facebook users, with over 2.32 billion active monthly users, Facebook remains the most widely used social media platform. Source: Oberlo
- 2hours – 20 Minutes is the average amount of time the average U.S. adult spends on social media and messaging. Source: Oberlo
- Tik Tok was the third most downloaded app in 2019. up to 118 million users, a growth of 70% since Q1 of 2018.
- LinkedIn is responsible for 80% of B2B leads from social media. Source: 99Firms
- InMail on LinkedIn has a 300% higher response rate than e-mail.LinkedIn says that 10 to 25 percent of InMail receives a response. Source: Hootsuite
Frequently Asked Questions
What percentage of revenue do companies spend on marketing?
Gartner’s 2026 CMO Spend Survey puts the average at 7.8% of company revenue. For home service companies we recommend 5% to 7%.
What is the most used social media platform in the U.S.?
YouTube. Pew Research Center found 84% of U.S. adults use it, followed by Facebook at 71%.
Is video marketing still worth it?
The data says yes. Wyzowl found 91% of businesses use video and 82% of marketers say it gives them a good return.
Wrapping up: which marketing statistics should change your strategy?
I’d love it if you have a moment – could you please add to the conversation below in the comments – did any of these statistics change the way you’re thinking about your next marketing campaign?
Are you shifting your efforts from traditional ‘content is king‘ blogging to video?
Are you waiting for data to come in on LinkedIn ads, or Tik Tok?